by Alexis Devenin, MBA, PMP
When we think of project success, we think in several variables. First of all, in the “Iron Triangle”, that means scope, time and cost. Additionally, we think of quality, sustainability, and safety. In each of these parameters, it’s expected that the project achieves a specified performance. If we think in a simple case in which all the parameters have the same importance, we can draw a spider chart with all the variables, setting the performance target as the 100%, and then draw the projected or actual performance, like in the next example:
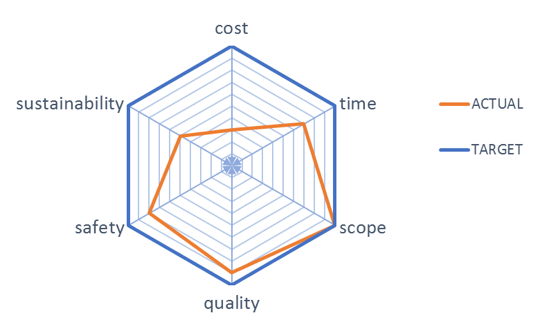
In the example, the project performs very good in scope and quality, fairly good in safety, regularly in time, unsatisfactory in sustainability and very poor in cost. The radial chart allows you to see the gaps between target and actual performance. Nevertheless, this is a neutral regard in which all the parameters have the same importance or weight in the evaluation. We have to realize that each stakeholder or group of stakeholders have different priorities and they value differently the importance of the variables in the project success.
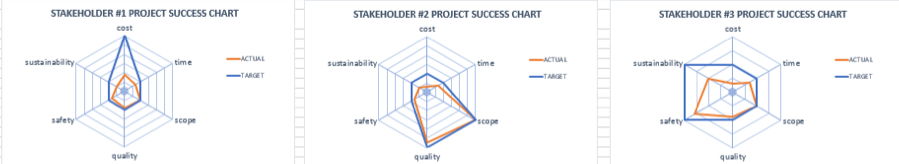
Consider a stakeholder for whom the most important parameter is cost. For this stakeholder, the cost performance has the double of importance than the performance of time, scope and other parameters. We can visualize that including a weighting factor in the cost variable in the radial chart. For this stakeholder, the success pattern has the following shape:
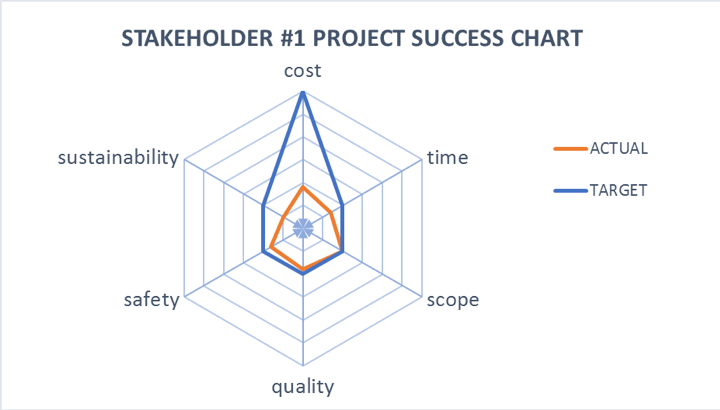
You can see a very different success pattern shape than the previous equal weighted parameters chart. And you can notice that the performance of the project looks very much worst in this chart than in the first. Clearly, for this stakeholder, the project presents a very poor performance.
Now consider a second stakeholder, one who is focused in scope and quality, probably the final user of the product of the project (for instance an operation’s manager in the case of the project consist in a production line). In this case, the project success pattern has the following shape:
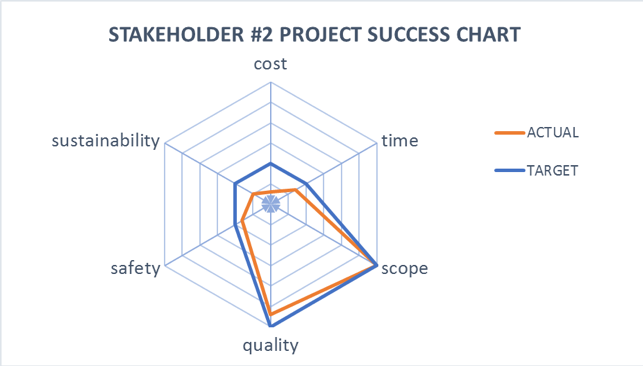
For this stakeholder, the performance of the project looks very good, and you can visualize that in the fact that the shape of the actual performance pattern “fits” very well in the success pattern shape.
As a third case, consider a stakeholder concerned with safety and sustainability. For this stakeholder, the success pattern shape is the following:
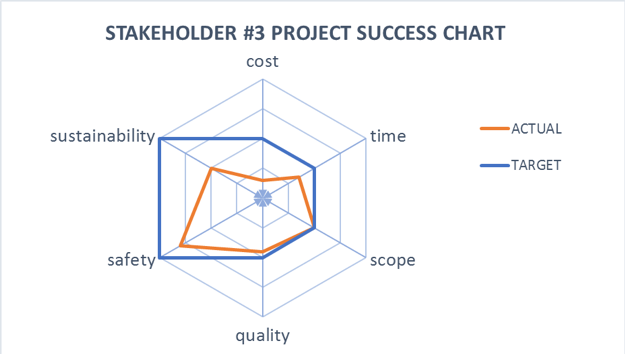
This stakeholder will judge the project performance as insufficient or unsatisfactory, and you can visualize that in the fact that the actual performance pattern presents large clearances into the success pattern shape.
Now let’s look at the same time the three “success pattern shapes” associated with the three stakeholders:
We are talking about the same project, with exactly the same performance, but here we have three very different success criteria and three very different evaluations of the achieved performance.
I would like to invite you to do this exercise in your project. You can implement it in a spreadsheet or even you can do it on a piece of paper. While doing this exercise, you will have to reflect on your stakeholders’ priorities and values, and with the insight that you acquire, you will be better prepared to manage them, and you will know where to focus your work and resources to minimize the more valued performance gaps.

 About the Author: Alexis Devenin is a Mechanical Engineer with his MBA and PMP certification. He is an Engineering Project Manager with 20 years of experience in the Steel, Mining and Renewable Energy industries.
www.linkedin.com/in/alexisdevenin


.png)


